Articles

Category Latest WINEP map update: Your local waters. A clearer picture.   Show all

  • Your local waters. A clearer picture.

    Explore the updated WINEP map to discover where investment is happening to improve rivers, lakes and coasts across England.

    We know how much rivers, lakes and coasts matter to the communities around them and people want to understand what is being done to improve them and what water company investment means locally. Our interactive Water Industry National Environment Programme (WINEP) map shows where investment is planned and what actions are being taken to improve water quality. The original map was named Joint winner of the Making a Difference Award at the Government Geography Profession Award, but we wanted to make it even more useful. Since launching the map a year ago, we’ve added more data and locations and made the information clearer and easier to understand.

    The Clear Waters partnership, of which we are a member, brings together regulators, consumer representatives, environmental groups, local government and the water sector to improve transparency about work to improve the water environment. This update supports the partnership’s action plan by making information about local investment and action easier to find and understand. Feedback from the Clear Waters network will help shape further improvements to the map.

    WINEP sets out what water companies in England must do to meet their environmental obligations and improve the water environment.

    For 2025 to 2030, £22.1 billion was secured for this work, from monitoring to infrastructure that protects and improves rivers, coasts, groundwater and the wider environment.

    You can now explore more than 22,000 individual actions, using the map’s search and filters to focus on the places and types of work that matter to you. Filter by function, action type, completion status and planned due date to help you understand what is happening locally to improve water quality. We will update the map annually throughout the five-year period to demonstrate progress.

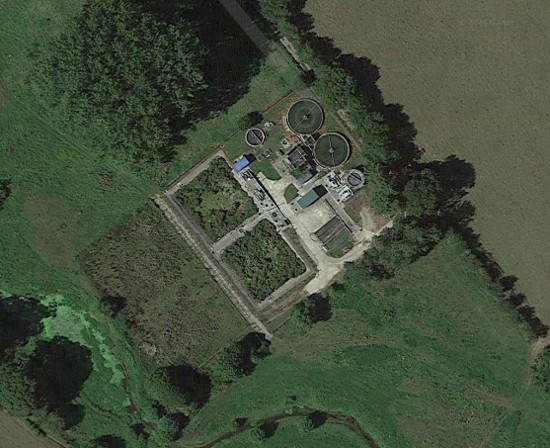
    Around 475 actions cover a whole water company area or river catchment, rather than one specific place. These include projects to control invasive and non-native species. We have also included unfinished actions from the two previous investment periods, known as AMP6 and AMP7. This gives you a fuller picture of outstanding commitments, alongside the current programme. Where actions are late, we work with the water company to find out why and look to resolve the delay. Delivery counts towards each company's annual Environmental Performance Assessment (EPA) rating, and lower ratings have real reputational and financial consequences. Completed action - upgrade to Hampstead Norreys Sewage Treatment Works
    We want the maps to be as accessible and easy to understand as possible so we’ve made the technical codes, which explain the legal or environmental reason for each action, a lot simpler.

    We’ve also made changes to column headings across the dataset and map to be clearer and more meaningful to a wider audience. These may seem like small changes, but together they make a highly technical programme much easier to explore.

    Investment must translate into action to improve water quality. By making commitments and progress easier to see, the map helps people hold water companies to account for delivery in the places they care about.


    Explore the updated WINEP map to discover where investment is happening to improve rivers, lakes and coasts across England.

    We know how much rivers, lakes and coasts matter to the communities around them and people want to understand what is being done to improve them and what water company investment means locally. Our interactive Water Industry National Environment Programme (WINEP) map shows where investment is planned and what actions are being taken to improve water quality. The original map was named Joint winner of the Making a Difference Award at the Government Geography Profession Award, but we wanted to make it even more useful. Since launching the map a year ago, we’ve added more data and locations and made the information clearer and easier to understand.

    The Clear Waters partnership, of which we are a member, brings together regulators, consumer representatives, environmental groups, local government and the water sector to improve transparency about work to improve the water environment. This update supports the partnership’s action plan by making information about local investment and action easier to find and understand. Feedback from the Clear Waters network will help shape further improvements to the map.

    WINEP sets out what water companies in England must do to meet their environmental obligations and improve the water environment.

    For 2025 to 2030, £22.1 billion was secured for this work, from monitoring to infrastructure that protects and improves rivers, coasts, groundwater and the wider environment.

    You can now explore more than 22,000 individual actions, using the map’s search and filters to focus on the places and types of work that matter to you. Filter by function, action type, completion status and planned due date to help you understand what is happening locally to improve water quality. We will update the map annually throughout the five-year period to demonstrate progress.

    Around 475 actions cover a whole water company area or river catchment, rather than one specific place. These include projects to control invasive and non-native species. We have also included unfinished actions from the two previous investment periods, known as AMP6 and AMP7. This gives you a fuller picture of outstanding commitments, alongside the current programme. Where actions are late, we work with the water company to find out why and look to resolve the delay. Delivery counts towards each company's annual Environmental Performance Assessment (EPA) rating, and lower ratings have real reputational and financial consequences. Completed action - upgrade to Hampstead Norreys Sewage Treatment Works

    We want the maps to be as accessible and easy to understand as possible so we’ve made the technical codes, which explain the legal or environmental reason for each action, a lot simpler.

    We’ve also made changes to column headings across the dataset and map to be clearer and more meaningful to a wider audience. These may seem like small changes, but together they make a highly technical programme much easier to explore.

    Investment must translate into action to improve water quality. By making commitments and progress easier to see, the map helps people hold water companies to account for delivery in the places they care about.