Detailed explainers
Explainer #6_Detailed
In depth explainer:
England's Water Environment: What the Classification Results Tell Us
Clean and healthy water is essential for people, nature and local economies. Our classifications help us identify where rivers, lakes, estuaries, coastal waters and groundwater are under pressure, so we can target action where it is needed most.
The statistics on this page provide a national overview of environmental condition across England. They highlight the key pressures affecting water quality, water resources and wildlife, but they do not tell the whole story.
Using classification results
Classifications are designed to support catchment planning and the management of individual water bodies. Monitoring locations are chosen to help us identify environmental pressures and understand where improvements are needed.
Because monitoring networks, assessment methods and available evidence can change over time, classification statistics should not be used to assess long-term environmental trends. They provide a snapshot of conditions at a particular point in time.
Where classifications show a change in status, further investigation is needed to understand the cause. Some changes reflect genuine environmental improvements or deterioration. Others may result from changes to monitoring, data availability or assessment methods.
What the statistics show
The tables below show the percentage of assessed elements achieving good status or better, alongside those that remain at moderate status or worse.
The results help us understand where pressures continue to affect water quality, ecology and water resources. They also help direct future action through catchment planning and environmental improvement programmes.
While individual results vary, the statistics highlight areas where further improvement is needed, particularly for elements such as fish, nutrients and aquatic plant communities.
Important to remember
Classification results are one part of the evidence we use to protect and improve the water environment. To understand what is really happening in a catchment, classifications must be considered alongside local investigations, monitoring data and other supporting evidence.
Key message: These results help us identify where action is needed to improve the health of England's waters. They are a valuable planning tool, but they are a snapshot of environmental pressures, not a measure of long-term trends.
Surface Waters
The number of assessed elements of each type at good or better status for all surface water bodies: 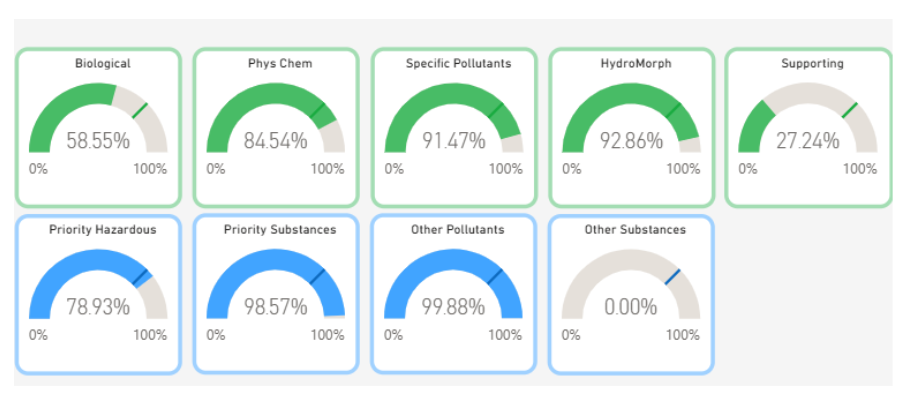 The number of assessed elements of each type at good or better status in Rivers: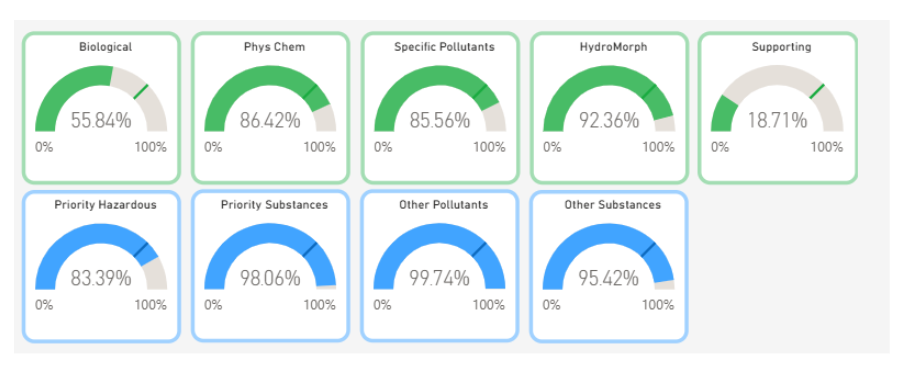
The number of assessed elements of each type at good or better status in Lakes:
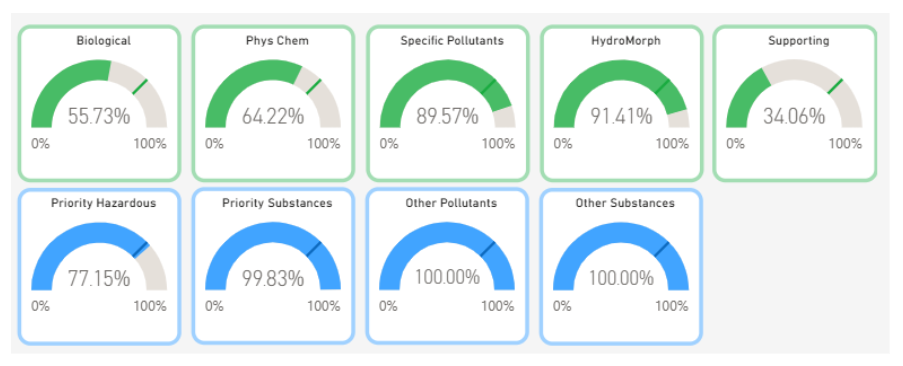 The number of assessed elements of each type at good or better status in Coastal and Estuarine waters: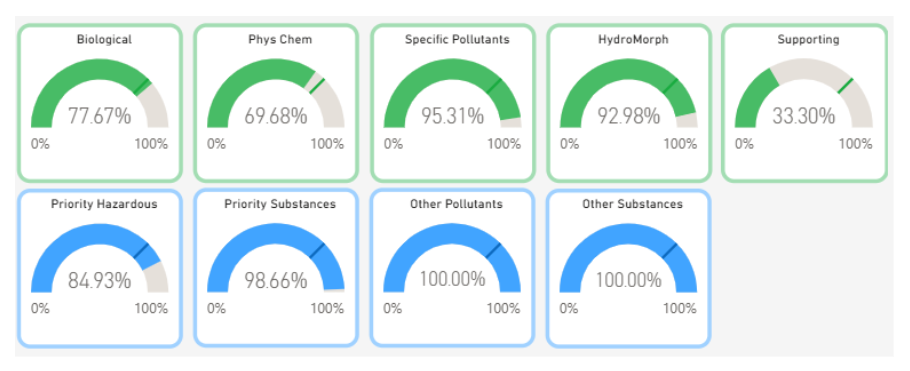
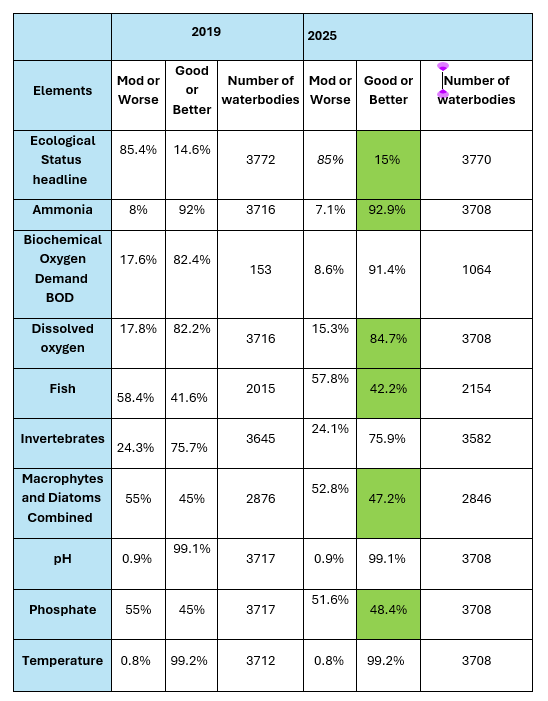
Percentage of assessed ecological elements achieving good status in Rivers:
Summary statistics for ecological status and potential in all surface water bodies 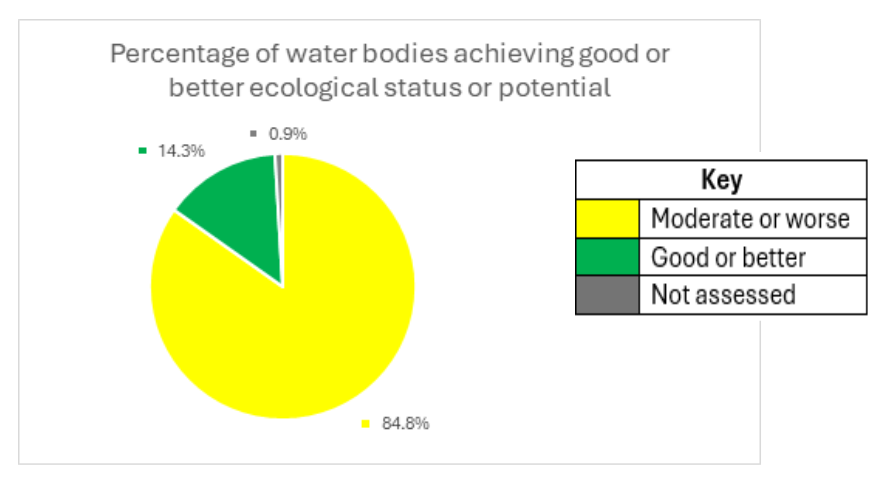
Some water bodies were not assessed this year due to the removal of Expert Judgment classifications.
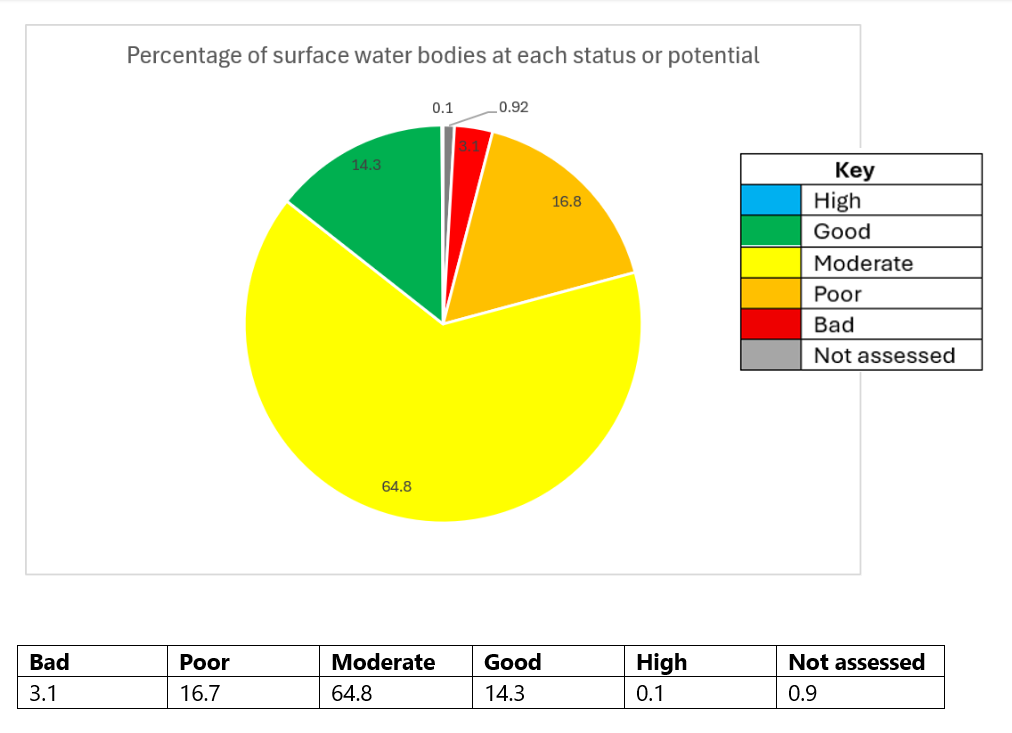
The number of water bodies can also be looked at by reviewing the number of water bodies at every status not just whether they are better than good.
Ground Waters
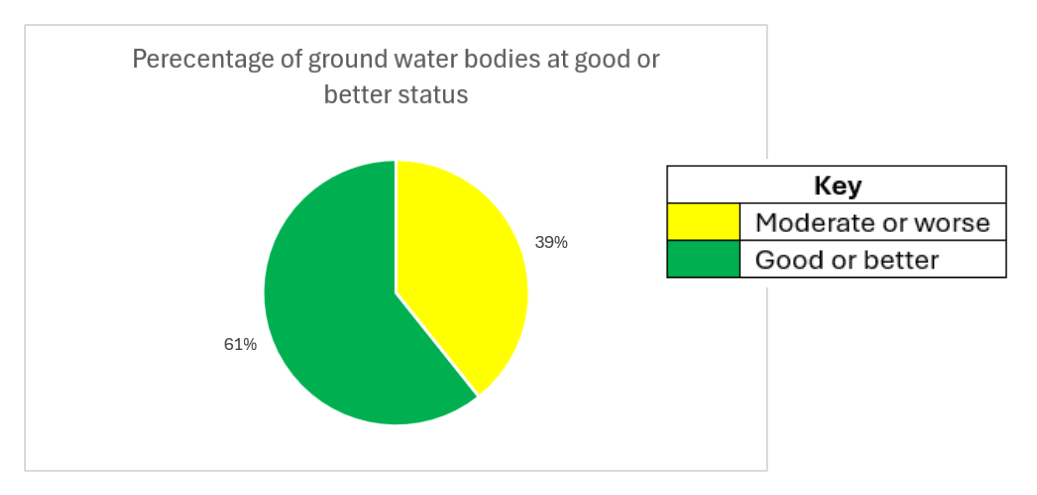
The number of assessed elements of each type at good or better status in groundwater bodies.
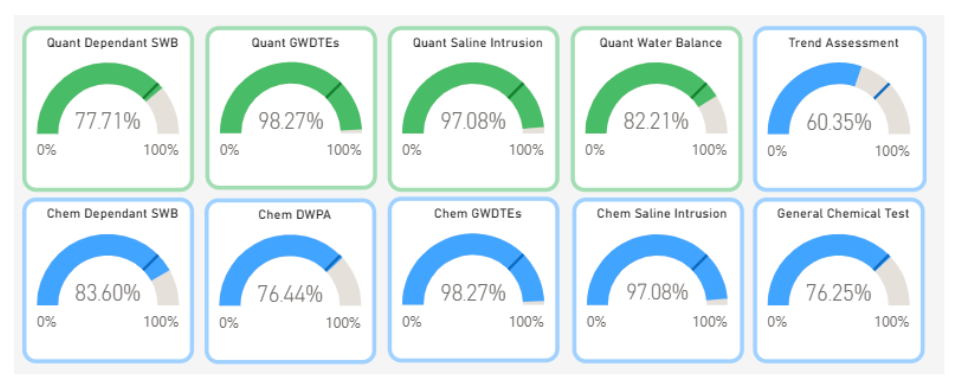
Table showing element level classification results in 2019 and 2025
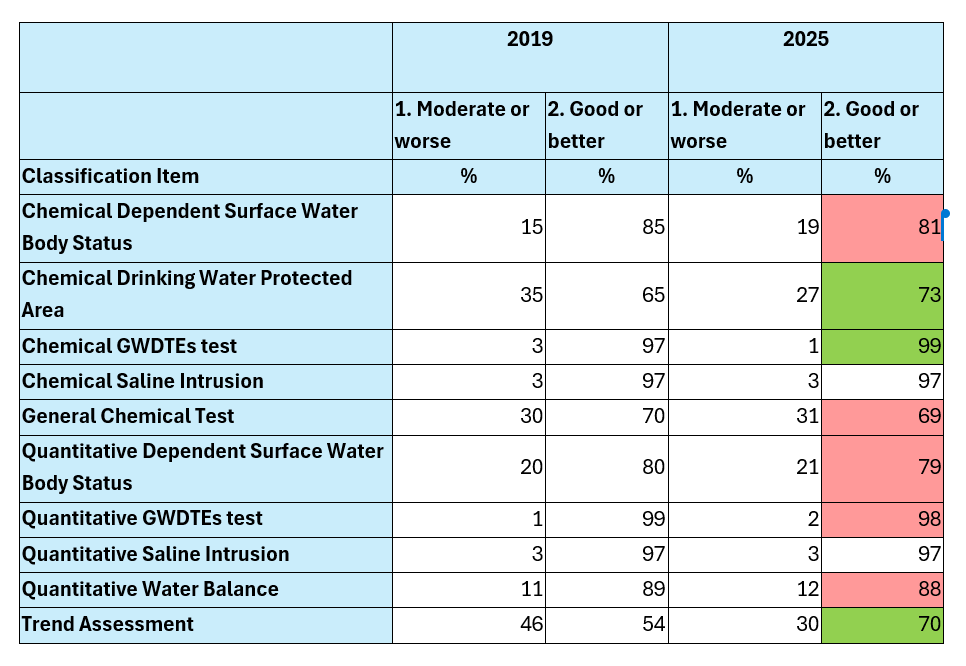
Summary statistics for overall groundwater classifications